


 Voyager Suite
 Breeze
 Virtuoso
 Investment Suite
 RentCafe
 CommercialCafe Suite
 Elevate Suite
 Procure to Pay Suite
  Energy Suite
 Aspire
 RightSource
 Care Suite
 Matrix
 WorkCafe
 Yardi Kube Suite
 ScreeningWorks Pro
  Yardi Corom



















The U.S. Energy Information Administration, the U.S. Department of Energy’s statistical and analytical agency, provides annual projections for U.S. and world energy markets over the next 30 years. Highlights from the latest release:
Overall
- U.S. energy consumption will grow more slowly than gross domestic product as energy efficiency continues to increase.

- Purchased electricity consumption will increase by 0.6% and 0.8% annually in the residential and commercial sectors, respectively, due to increased demand for electricity-using appliances, devices and equipment.
- In 2019, 44% of residential light bulbs were LEDs, the most efficient light bulb technology available, and 17% of commercial lighting service demand was met by LED bulbs and fixtures. By 2050, these shares will reach 90% and 88%, respectively.
- Energy-related CO2 emissions decrease initially then rise closer to 2050 as economic growth and increasing energy demand outweigh improvements in efficiency.
- After initially falling, total U.S. energy-related CO2 emissions will grow modestly in the 2030s, driven largely by increases in energy demand in the transportation and industrial sectors. Emissions in 2050 will still be 4% lower than 2019 levels.
- Increases in fuel economy standards will drive a 19% decrease in U.S. motor gasoline consumption through 2050.
- The U.S. will continue to export more petroleum and other liquids than it imports as domestic crude oil production continues to increase and domestic consumption of petroleum products decreases.
Renewables/biofuels
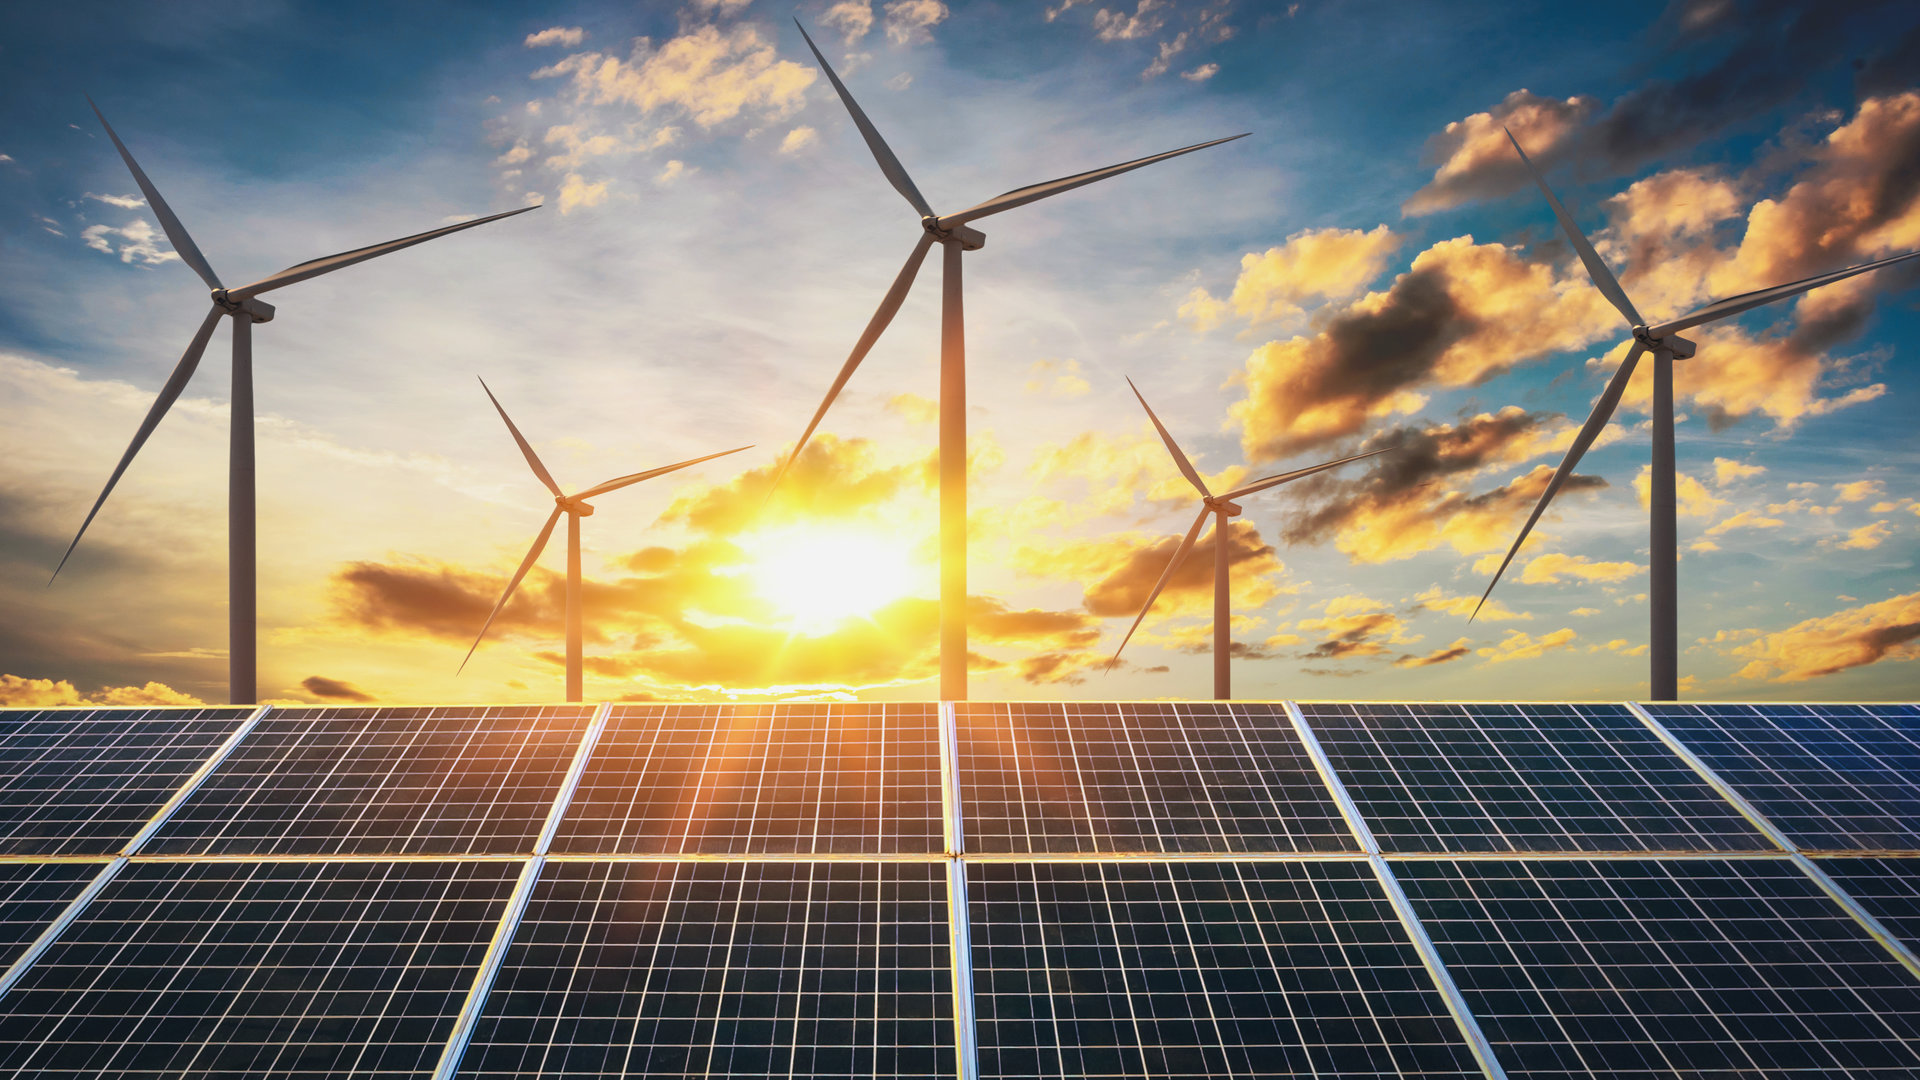
- Renewables will be the fastest-growing source of electricity generation due to continuing declines in solar and wind capital costs coupled with federal tax credits and higher state-level targets. Total renewable generation will exceed natural gas-fired generation after 2045. Without distributed generation sources, particularly rooftop solar, electricity consumption in residential and commercial buildings would be 5% and 3% higher, respectively, by 2050.
- Generation from renewable sources will rise from 18% of total generation in 2018 to 38%. Solar photovoltaic (PV) will contribute the most to the growth in total renewable generation, increasing from 13% in 2018 to 46%. Although onshore wind generation will more than double, its share of renewable generation will go from 37% to 29%.
- The U.S. will add 117 gigawatts of new wind and solar capacity between 2020 and 2023.
- Electricity is the fastest-growing energy source in the transportation sector, increasing by an average of 7.4% per year as a result of increased demand for electric light-duty vehicles.
- While gasoline vehicles will remain the dominant vehicle type through 2050, the combined share of sales from gasoline and flex-fuel vehicles (which use gasoline blended with up to 85% ethanol) declines from 94% in 2019 to 81% because of growth in sales of battery electric vehicles, plug-in hybrid electric vehicles and hybrid electric vehicles.
- The percentage of biofuels (ethanol, biodiesel, renewable diesel, and biobutanol) blended into U.S. gasoline, diesel, and jet fuel will increase from 7.3% in 2019 to 9% in 2040.
Commercial and industrial space
- Total delivered energy consumption in the U.S. buildings sector will grow by 0.2% annually as energy efficiency improvements, increased distributed electricity generation and regional shifts in the population partially offset the impacts of higher growth rates in population, number of households and commercial floor space.
- Lower costs and energy efficiency incentives will result in efficient LEDs displacing linear fluorescent lighting as the dominant commercial lighting technology by 2030.
- Commercial PV capacity will increase by an annual average of 3.4%.
Residential space
- S. total delivered residential energy intensity, defined as annual delivered energy use per household, will fall by 17% between 2019 and 2050 as the number of households grows faster than energy use. Factors contributing to this decline include gains in appliance efficiency, onsite electricity generation (e.g., solar photovoltaic), utility energy efficiency rebates, rising residential natural gas prices, lower space heating demand and population shifts to warmer regions.
- Residential PV capacity will increase by an average of 6.1% per year, accelerated by rising incomes, declining system costs and social influences.
Learn how Yardi software can increase energy efficiency across all commercial and residential property types.