

 Voyager Suite
 Breeze
 Virtuoso
 Investment Suite
 RentCafe
 CommercialCafe Suite
 Elevate Suite
 Procure to Pay Suite
  Energy Suite
 Aspire
 RightSource
 Care Suite
 Matrix
 WorkCafe
 Yardi Kube Suite
 ScreeningWorks Pro
  Yardi Corom



















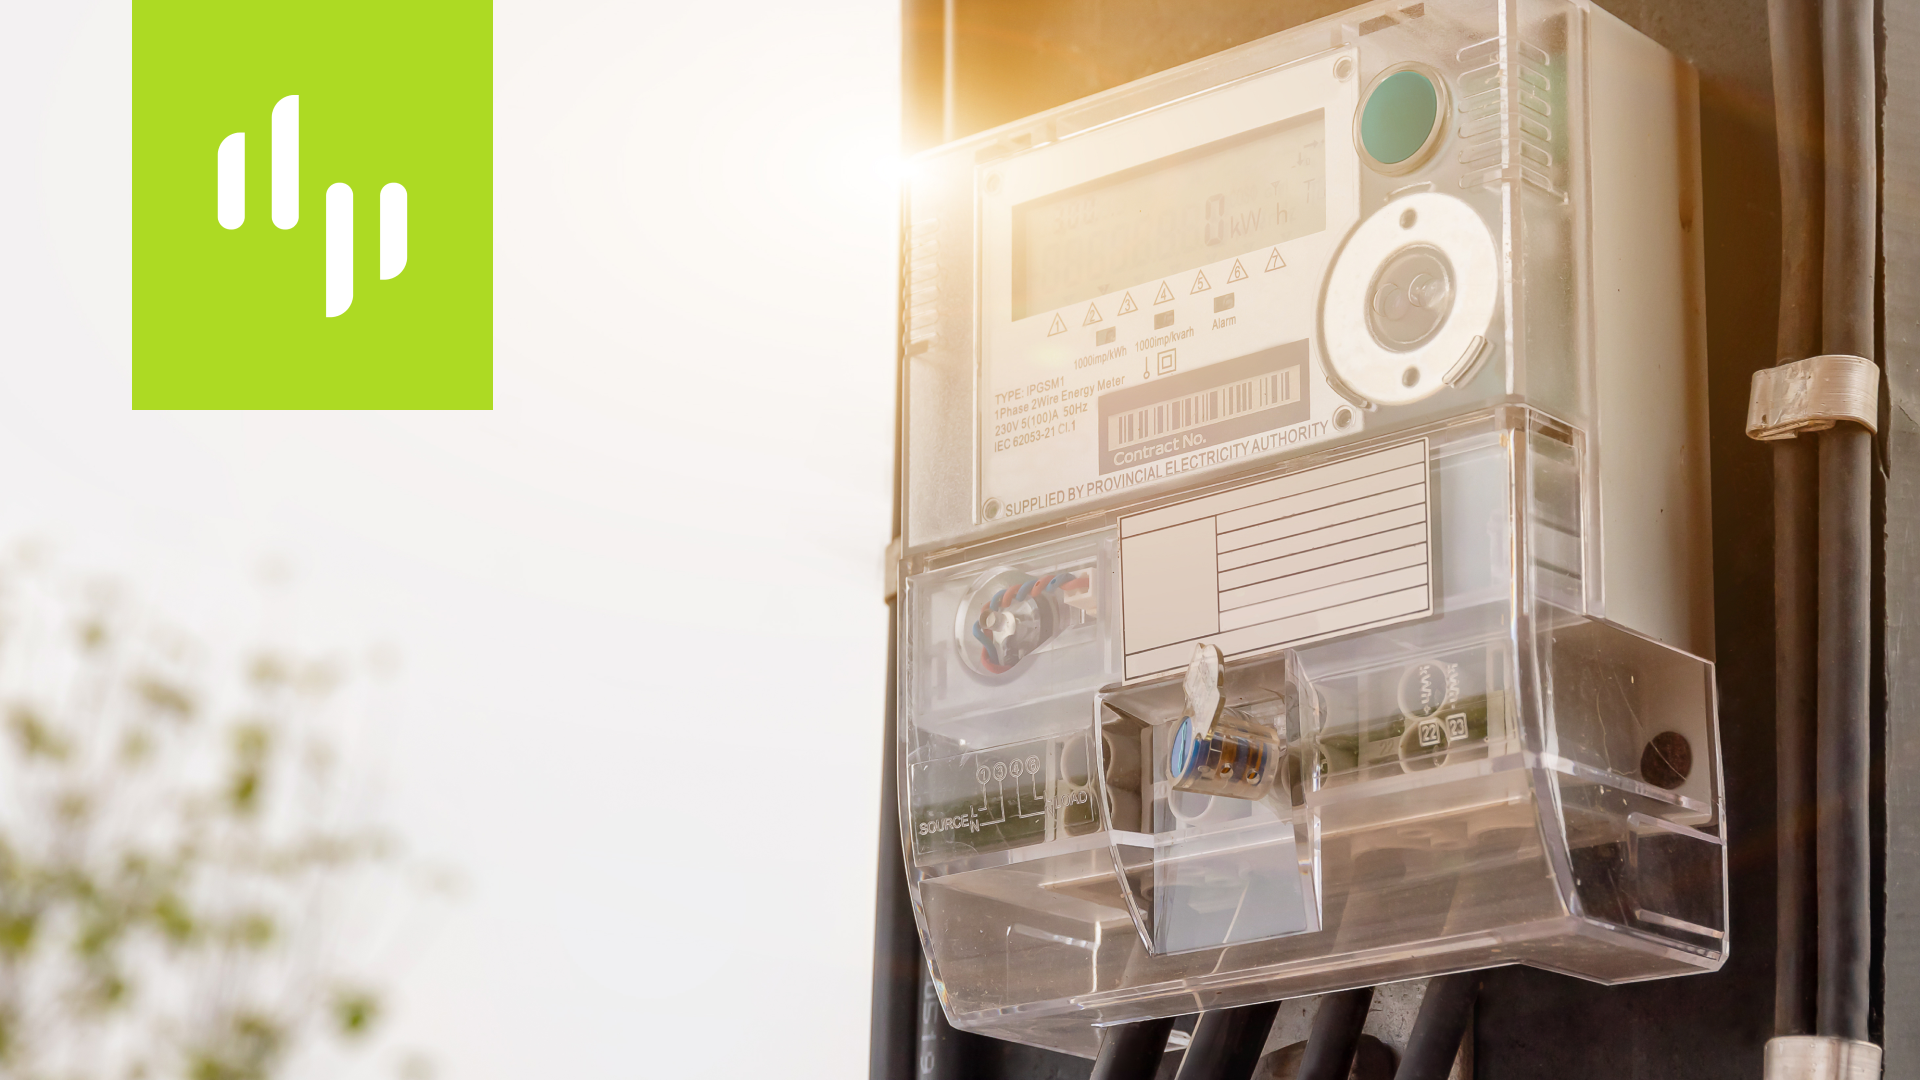
Are you paying more than you should for property utilities because leaks and equipment issues are draining energy resources undetected? Yardi Meter Insights harnesses interval data to give building owners clearer control over energy management.
A utility bill shows how much energy a building used over an entire billing period. But it only tells part of the story. What it can’t reveal is whether energy was consumed during occupied hours, overnight, on weekends or during a handful of unusually expensive peaks.
Meter Insights: Converting interval data into insights
That’s where Yardi Meter Insights comes in. It monitors energy and water usage live to identify issues across a portfolio before they become costly problems. It also translates interval data — meter readings collected every 15, 30 or 60 minutes throughout the day — into insights that flag problems before they escalate and cost money.
Those insights reveal whether HVAC equipment ran overnight, whether simultaneous system starts occurred, if a piece of equipment operated continuously or whether a water line leaked after hours.
Making a score into a story
Meter Insights compares actual performance with a baseline that accounts for weather, operating schedules and other factors. That context matters: increased energy use during extreme weather may be reasonable, while the same increase during mild conditions may deserve investigation.
Interval data connects utility expenses to building operations. It reveals when energy is used, where unusual patterns exist and which properties merit attention first. Meter Insights helps teams spend less time interpreting data and more time acting on it.
Instead of seeing one monthly total, Meter Insights users know when and how a building uses energy. That turns a utility bill from a score into a story — one that reveals:
- Whether consumption decreased when the building closed
- Whether equipment continued operating overnight with no one present
- Whether usage suddenly changed from the building’s normal pattern
- Whether steady water consumption during off hours indicates a leak or other operational problem
Meter Insights also provides:
- Alerts for demand spikes, off-hours usage and potential meter issues
- Cumulative savings tracking against a baseline
- Historical, weather-normalized models that spot outliers by tracking and comparing building performance
- Granular data views with time overlays, heat maps and more that spotlight opportunities for improvement
New hardware is not always needed
Meter Insights’ benefits come through better use of data building owners already have, not necessarily by installing additional hardware.
Where supported by the utility, electric interval data may be available through a utility data connection or API, enabling meter data to flow into Meter Insights without installing new on-site metering hardware.
Energy bills without surprises
Eliminate surprises at billing time or wondering why utility expenses run so high. By using interval data to connect the bill to building operations, teams can act before the next bill arrives — investigating while there is still time to respond, not weeks later. This kind of intelligence can pay for itself many times over, especially for large properties with a single master meter.
See an on-demand demo to learn how to understand interval data and make it actionable.