By Paul Rosta on January 9, 2013 in News
 With the cost of operating commercial buildings growing ever harder to control, owners and managers will likely start taking a new look at contracts this year for the first time in quite awhile. While trends in operating costs will probably continue to vary widely by both location and property type, they nonetheless will see an uptick in many markets beyond that recorded during the past several years.
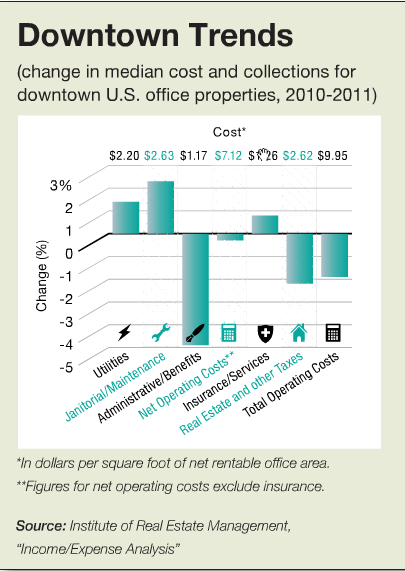
From 2010 to 2011, median operating costs for downtown office buildings ranged from a 4.5 percent increase in the Central, Rocky Mountain and Northwest regions to an 11.2 percent decline on the West Coast. Suburban office properties have showed a similar variation, as operating expenses dropped 3.3 percent in the Southeast and rose 9.6 percent on the West Coast. Nationwide, the changes for suburban office properties added up to a 1 percent year-over-year increase from 2010 to 2011. That was comparable to the 1 percent nationwide increase for shopping centers.
 In the past few years, property owners and managers have already taken steps to reduce or control costs. For instance, they have largely reduced their energy outlays or at least made sure that costs increased more slowly than utility rates. For privately owned buildings, median utilities costs dropped from $2.38 per square foot to $2.32 per square foot between 2011 and 2010—a 2.5 percent decline, according to BOMA/Kingsley Associates research. The pattern of decreases or modest increases in utility costs is widely credited to the success of owners and managers with cost-cutting strategies that have become standard in recent years: low-usage lighting fixtures, sophisticated control panels that fine-tune power distribution and so forth.
In order to keep a lid on costs—or to reach the next level of cost reductions—owners may face a choice of investing in expensive retrofits or accepting cost increases. According to the most recent IREM research, for instance, energy costs for downtown office buildings increased about 1.4 percent from 2010 to 2011 nationwide. But while that suggests overall stability, the figure masks regional variations. During the past several years, downtown office buildings in the Central, Rocky Mountain and Northwest regions have demonstrated significant increases, including a 9.9 percent jump from 2010 to 2011, according to the Institute for Real Estate Management. Meanwhile, West Coast properties trimmed those costs 15.7 percent.
The suburbs told a different story: Except for the West Coast, properties all recorded a decline in energy costs during the same period. And in the retail sector, which has a somewhat different allocation of costs, property managers have likewise succeeded in keeping energy costs and other prices relatively stable. IREM’s most recent report shows that utilities represented 8.7 percent of operating costs, a percentage that has remained largely unchanged in recent years.
Costs are inching up in other categories of operations, as well. Owners and managers are watching tenant improvements, for instance. Between 2010 and 2011, costs for building out office space in privately owned properties edged up 10 percent, to $2.30 per square foot, according to the annual BOMA/Kingsley survey. New tenant leases and a desire by existing tenants to improve their space may be driving the increases, BOMA speculates.
On the plus side, taxes continue to offer fruitful ground for cost savings. According to IREM’s most recent research, the tax bill on suburban office properties declined 2.7 percent from 2010 to 2011, to an average of $2.14 per rentable square foot. That followed a 4.3 percent drop the previous year. Taxes on downtown office properties also slipped, declining 2.2 percent to $2.62 per square foot during the same period. This trend may in fact be the result of successful appeals of tax assessments—and thus it remains to be seen whether it will continue in the new year.
Paul Rosta is senior editor for Commercial Property Executive. For more on property management cost trends, including charts detailing how the dollars are being allocated, see “Holding the Line” in the December 2012 issue of CPE.


