

 Voyager Suite
 Breeze
 Virtuoso
 Investment Suite
 RentCafe
 CommercialCafe Suite
 Elevate Suite
 Procure to Pay Suite
  Energy Suite
 Aspire
 RightSource
 Care Suite
 Matrix
 Yardi Kube Suite
 ScreeningWorks Pro
  Yardi Corom

















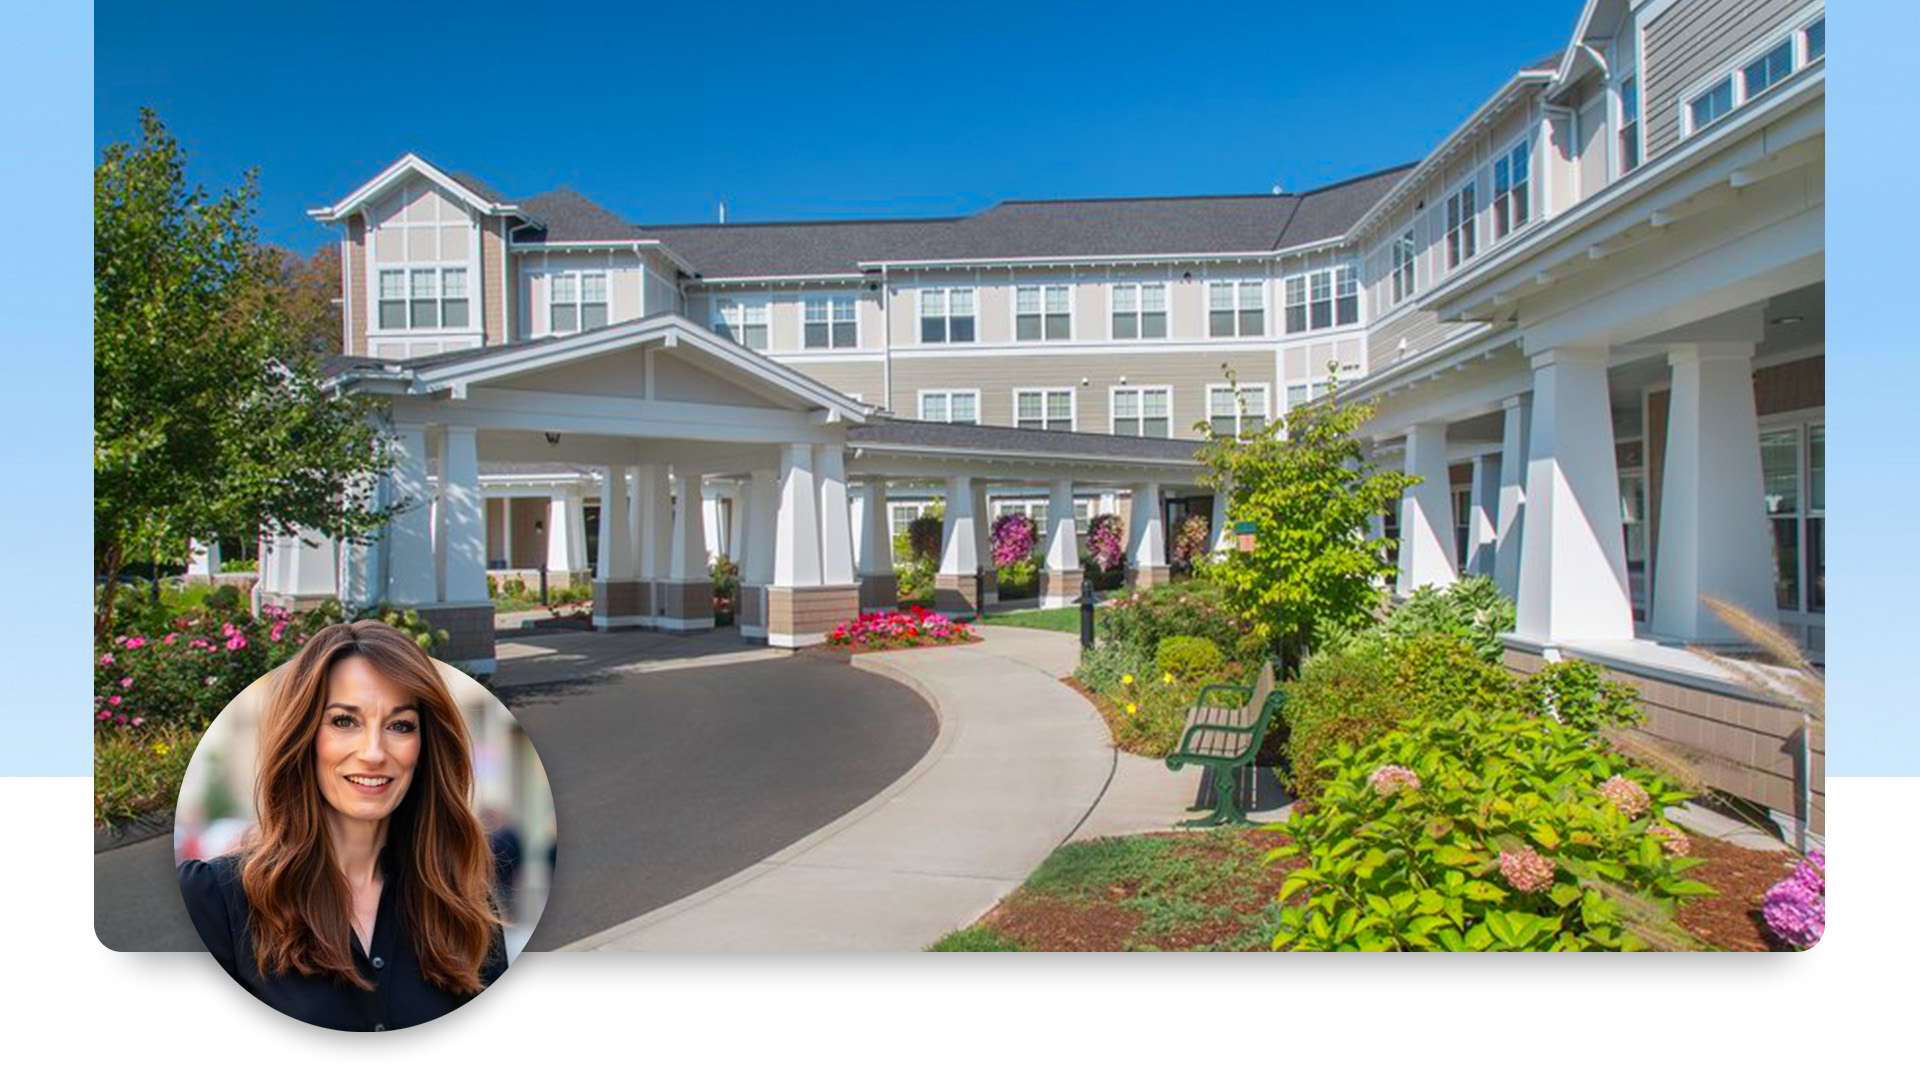
When you’re managing quality assurance metrics across a large senior living portfolio, collecting data manually takes time. And then your compiled data is often out of date before anyone can act on it. That was the reality for LCB Senior Living before the organization moved to real-time dashboards in Yardi Senior IQ.
“It has changed how we do business,” said Michele Gannon, senior vice president of care and quality assurance at LCB Senior Living. She describes Senior IQ as “an incredibly powerful tool that provides me the insight needed to manage 40+ communities.”
The challenge: Manual reporting & backward-looking data
Before using Senior IQ, LCB Senior Living relied on manual processes to gather QA metrics across its portfolio. Gannon said LCB had to hunt each of the communities for the metrics they needed. “It was labor intensive and often a backwards look at trends,” she said. This limited the team from responding quickly to patterns in data.
The solution: LCB Senior Living adopts Yardi Senior IQ
With Senior IQ, LCB Senior Living now accesses dashboards that pull identified metrics into one place. Everyone who needs the information has a real-time view of what’s happening across the portfolio. Leaders can access performance data in seconds, everyone can quickly identify trends and teams can focus on areas that need attention.
“Senior IQ has allowed for a real-time glimpse into what is happening in our portfolio,” Gannon said. “This allows [us] to dig in and change any negative trends and promote any positive trends.”
The story: Pulling data together, monitoring & acting on trends
LCB Senior Living uses Senior IQ to bring data from all communities into a central location. Custom dashboards provide visibility into regulatory, financial and clinical performance across the portfolio.
“It’s now used at our operations meeting to review trends, successes and areas of focus,” Gannon said. Leaders review current performance, focus on priorities and guide discussion about next steps — all from one platform.
Clinical teams use targeted reporting to monitor care for residents with specified high-risk health issues, identifying areas that need attention sooner.
Gannon’s favorite dashboard is a “Clinical At Risk” dashboard customized to LCB’s specific metrics. “It gives me everything I need to ensure the most fragile population is tended to timely,” she said. “The metrics are visual and allow the teams to dig into trends.”
What’s next
How can your organization move from manual reporting to real-time portfolio insight? Read the full LCB Senior Living success story and get the details about Yardi Senior IQ.