Senior IQ
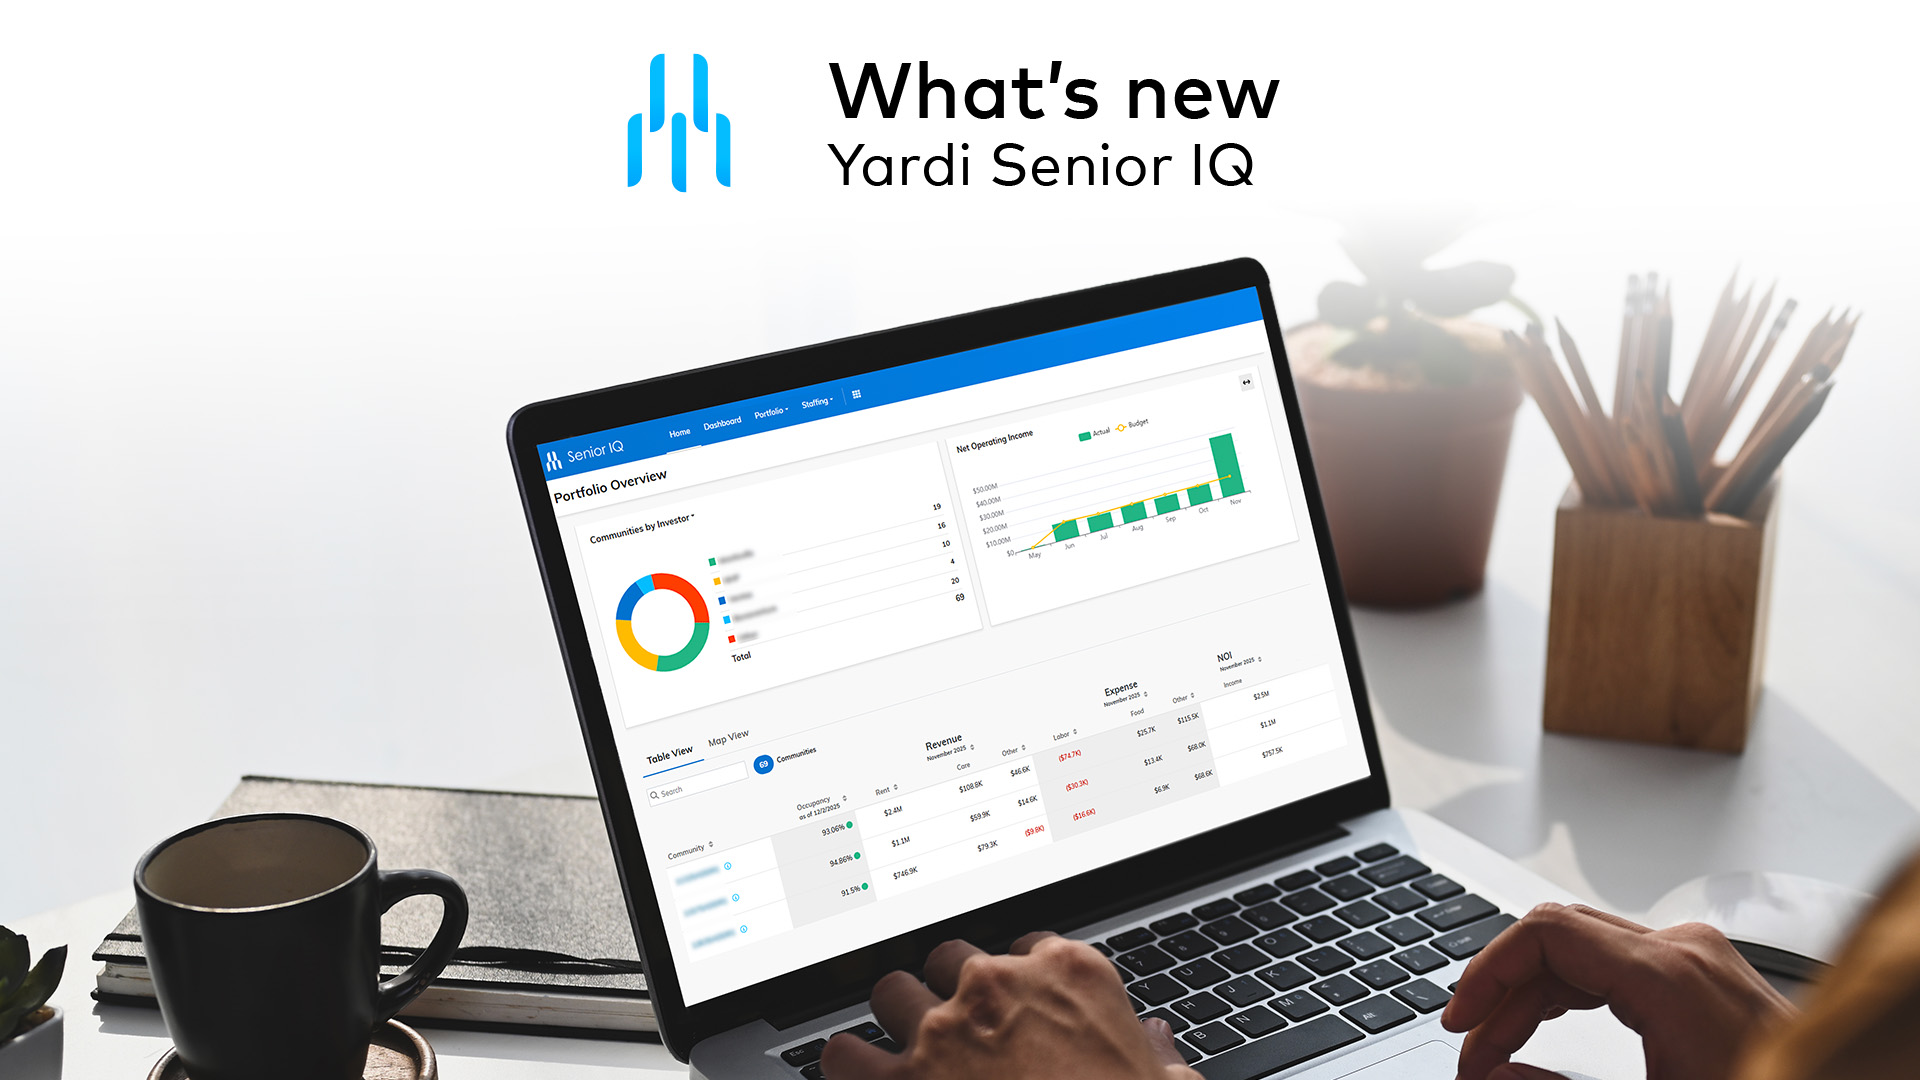

Vitality Living’s compelling senior living testimonial on Senior IQ
How do you manage and analyze your data to make informed decisions about resident care and staffing levels? Vitality Living found that real-time, accurate data in customizable dashboards helps them make strategic decisions that improve resident care, staffing levels and overall efficiency. Syndell Lawhon, vice president of wellness at Vitality Living, shares insights in two […]
04 / 21 / 25
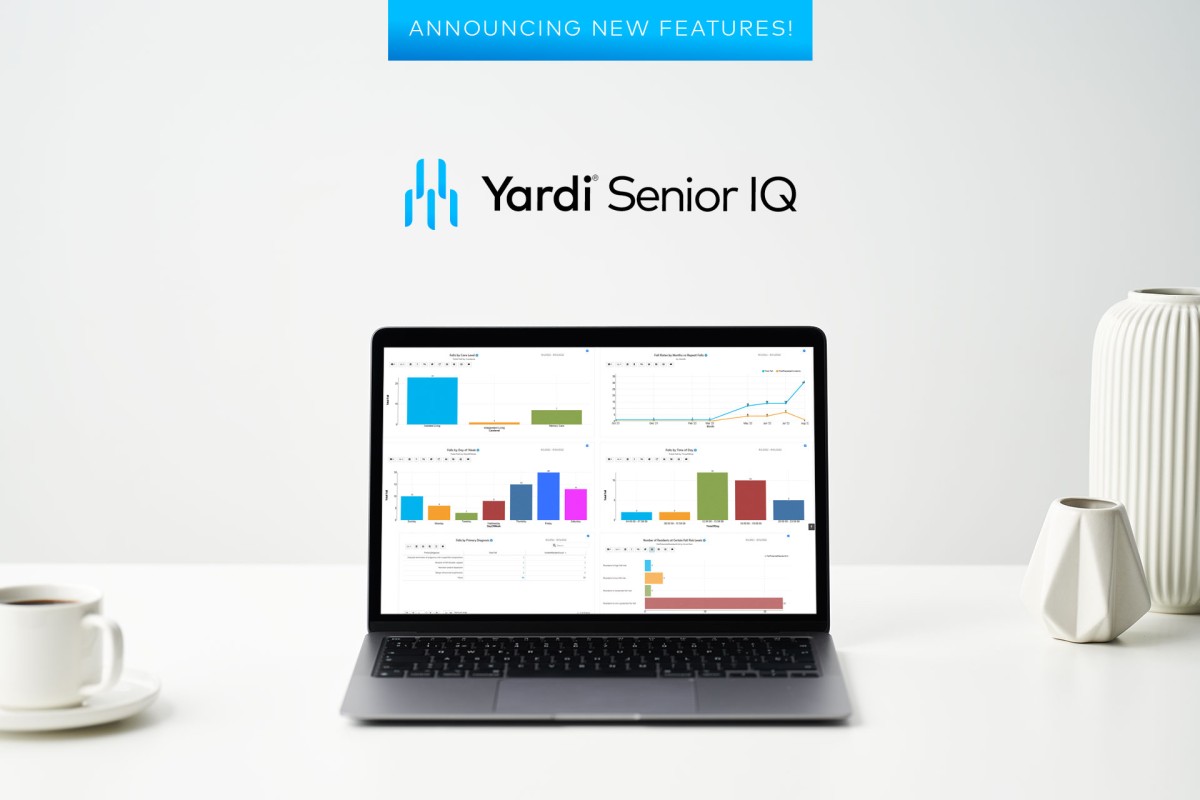
Announcing New Features!
You may be familiar with our senior living business intelligence solution, Yardi Senior IQ. This integrated system generates data at the click of a button to help operators make smarter, faster decisions. And when operators make informed decisions based on real-time data, senior living residents reap the benefits in the form of enhanced services and […]
09 / 20 / 22
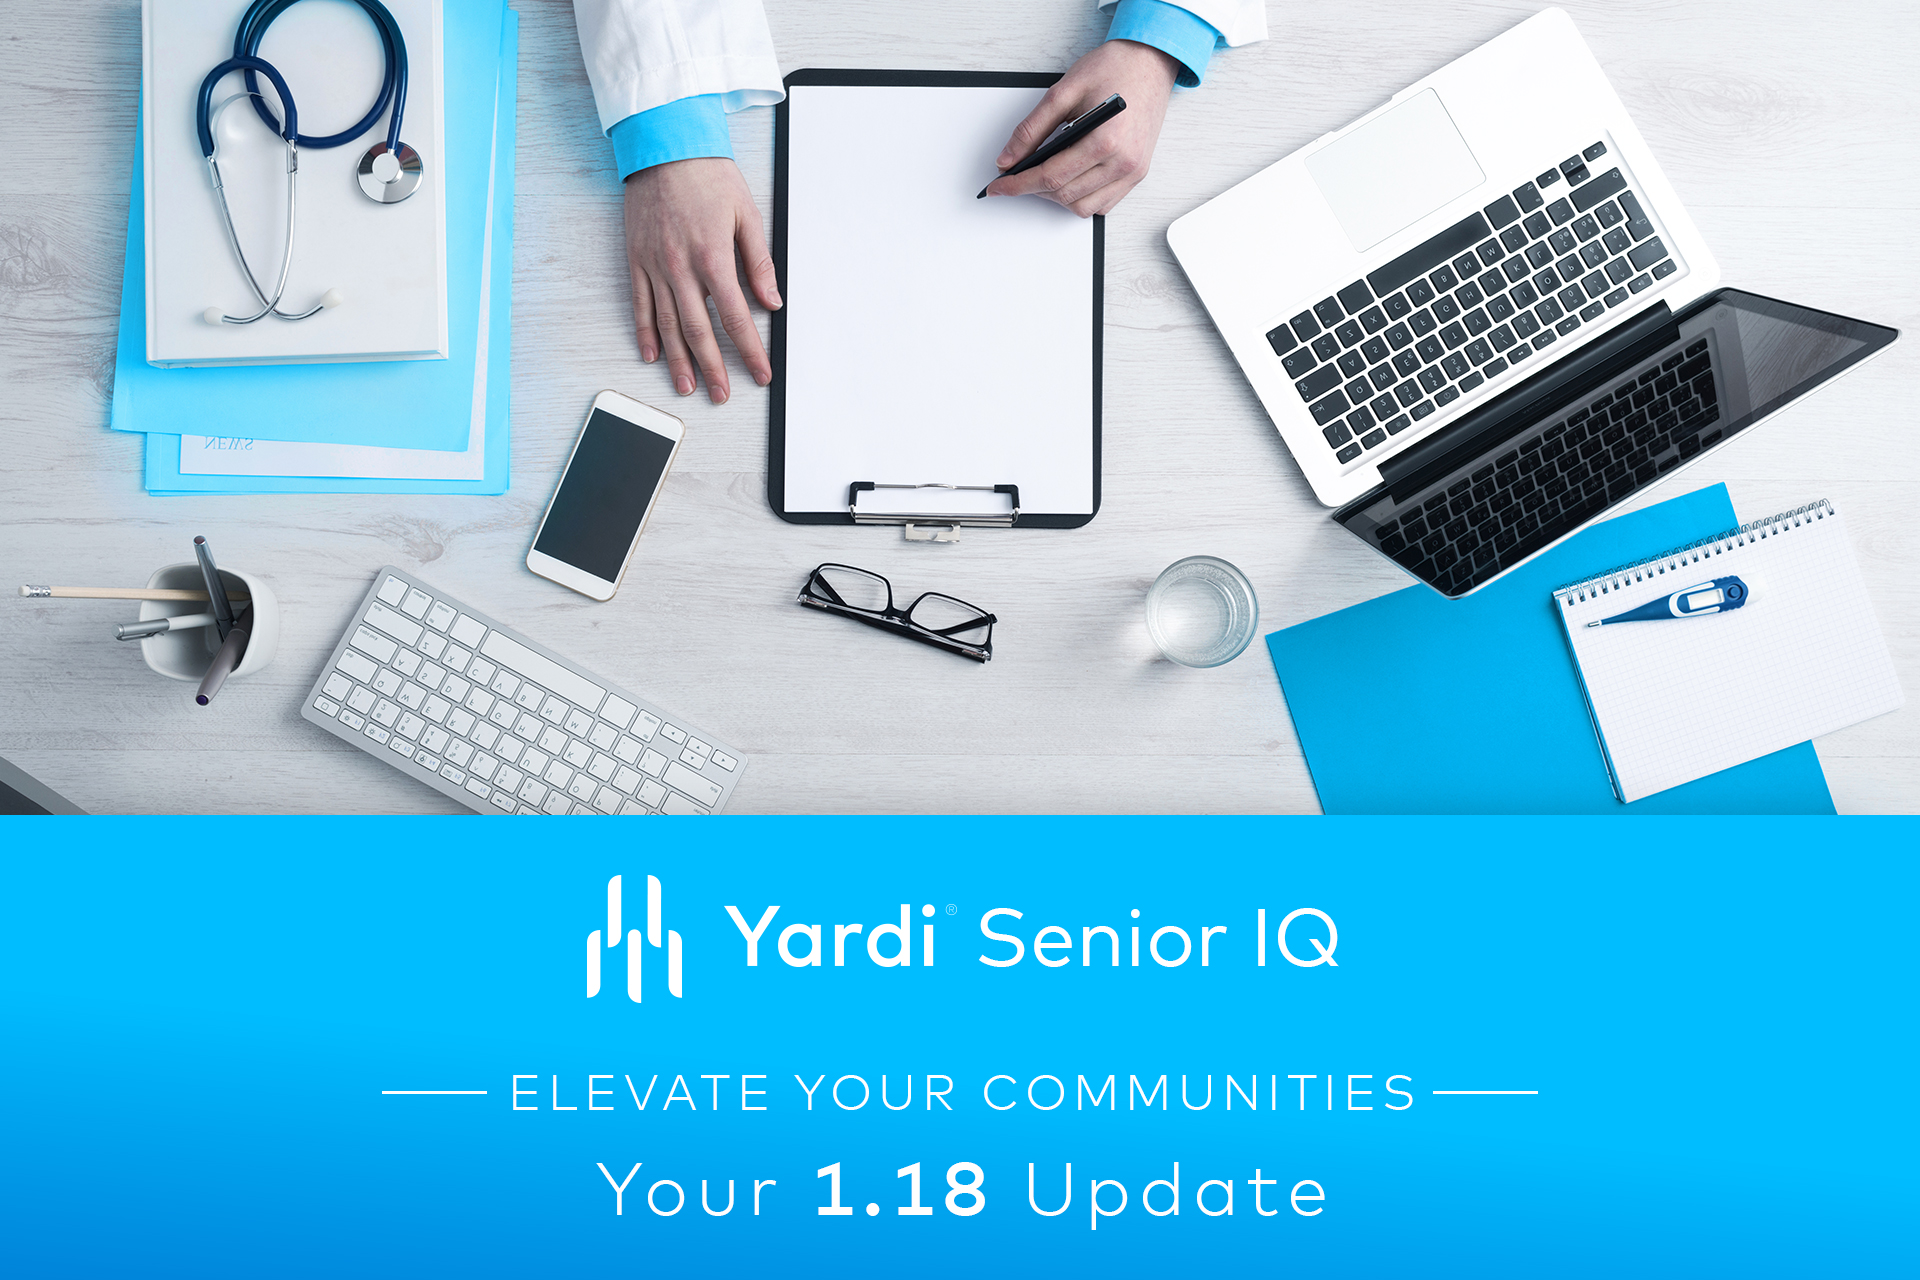
Tap Into Clinical Data
When it comes to viewing clinical data, senior living providers need a solution that paints the full picture. How many resident falls occurred during a particular shift this week? What percentage of residents are vaccinated against COVID-19? Thanks to the latest Senior IQ update — 1.18 to be exact — these answers are available at […]
04 / 06 / 22
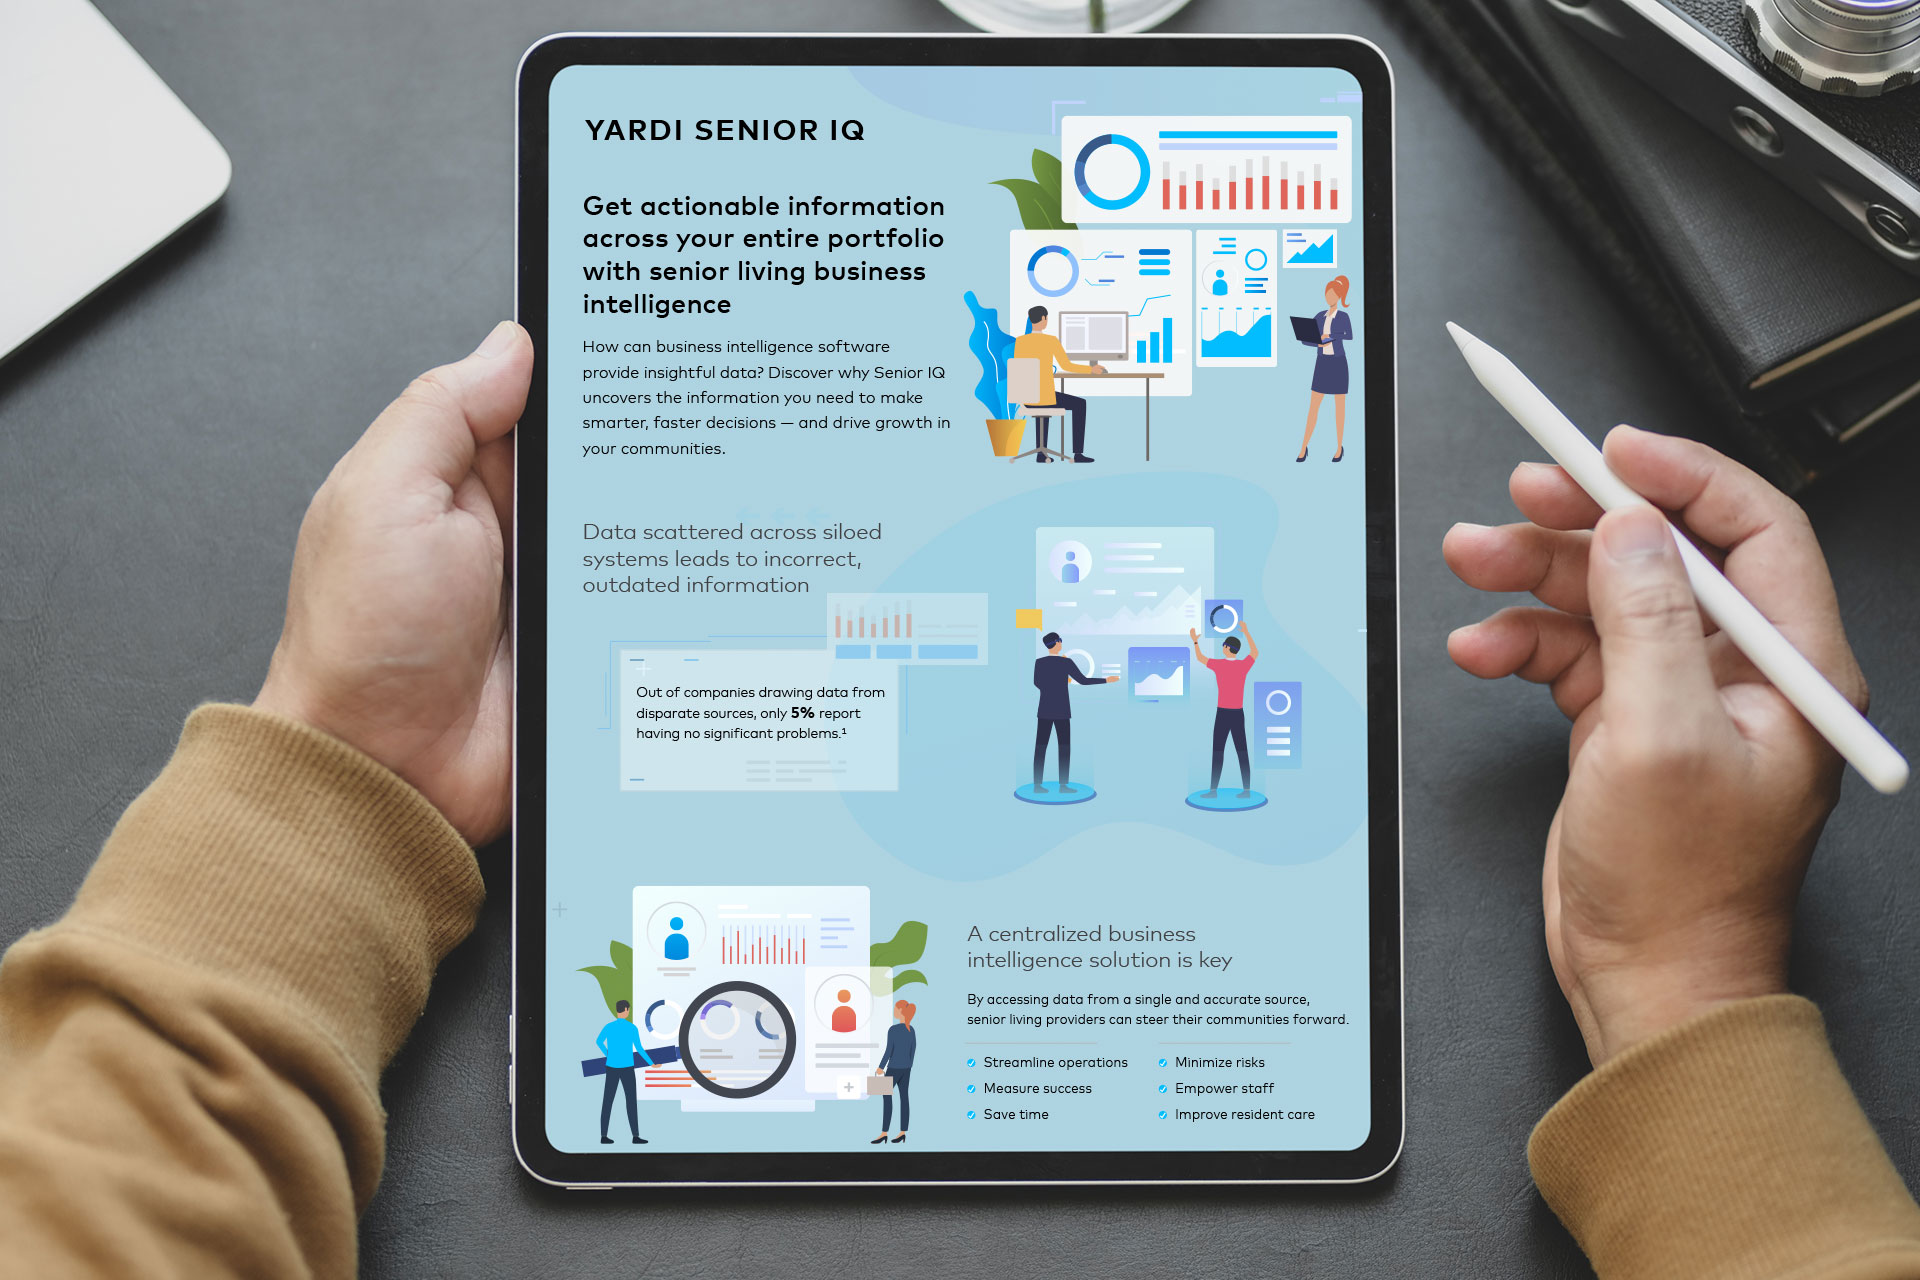
Thrive with BI
How can business intelligence (BI) software provide insightful data? Our resourceful infographic has the answers, painting a detailed picture of BI and its benefits. We’re here to share it with you. Keep reading to discover why a BI solution like Senior IQ uncovers the information needed to make smarter, faster decisions — and drive growth […]
01 / 04 / 22
Senior IQ Update
Yardi Senior IQ has been out for a few months now, and it’s already seen a huge amount of interest from the industry. As clients have gotten into the swing of things, their feedback is helping make the business intelligence solution even more useful for senior living. The latest release, Senior IQ 1.6, is now […]
08 / 20 / 20
ENERGIZED FOR TOMORROW
We’re here to help
Do more with innovative Property Management Software and services for any size business, in every real estate market.
Sorry, this video is unavailable as it is not hosted by Yardi Systems.